

By Rachael Pfenninger, director of strategic execution, AMBA
At the end of 2022, American Mold Builders Association (AMBA) members indicated that wages for their employee workforces continue to rise, despite continuing challenges related to inflation and the current economic environment. These mold manufacturers are hoping that, by offering competitive wages, they will be able to attract new employees from an increasingly limited talent pool.
Although inflation has slowed in 2023, the mold manufacturing industry continues to identify this element – alongside increasing competition and decreasing profitability – as top challenges in 2023 (as cited in AMBA’s 2023 Business Forecast Report).
For these reasons, US mold manufacturers must focus more than ever on driving profitability for their businesses. This is why the AMBA, again, surveyed US mold builders on charge rates across over 20 moldmaking, engineering and specialty services.
To complement its findings and provide a competitive edge to survey participants, the AMBA benchmarking team also added business insights and trending data that will help guide executives in their use of this year’s report.
To provide these insights, the AMBA team relied heavily on the provided charge rates, as well as other key data points, such as capacity utilization, gross margin percentages and overhead. This year’s report also highlighted the variation between attended and unattended rates (as applicable), reviewed the delta between 2022 and 2023 charge rates by individual service and featured industry insights from AMBA partners.
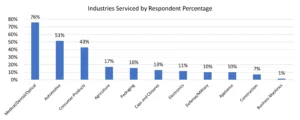
The final report includes survey responses from 70 US mold manufacturers, the majority of which are in the Midwest region, followed by the Eastern region of the United States. The industries served most frequently by this year’s respondents include the automotive, consumer products and medical/optical/dental industries.
For the second time, respondents indicated not just which markets they primarily served, but what percentage of work that industry accounted for over the last 12 months. Of the respondents represented in this data set, approximately three-quarters serve the medical/optical/dental market in some capacity, followed by over half that serve the automotive market (Chart 1).
Overwhelmingly, respondents – 87% – identified new mold/die builds as their primary revenue generator. To expound on revenue sources, this year’s survey also asked respondents to identify their second-largest revenue source (only identifiable if it generated 20% or more of total annual revenue over the last 12 months). Of the provided options, mold/die repairs and engineering changes were identified by 56% of respondents as the second-largest revenue source (a drop of 7% from 2022 data); another 11% identified this option as their primary source of revenue.
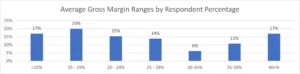
Respondents also were asked to provide their approximate gross margin percentage – calculated as ((Revenue – Cost of Goods Sold) / Revenue) x 100). This year, only 17% of respondents indicated that their average gross margin was relatively thin (under 15%) – a drop of nearly 50% from the previous year. In contrast, one-in-three respondents reported gross margin percentages of 30% or above (Chart 2).
On average, mold manufacturers reported a current utilization of 73%, with companies in the $1 million to $2.5 million range reporting the most positive outlook. Overall anticipated capacity utilization is expected to rise only 1% through the end of the year; however, companies in the $10 million to $19.9 million reported the most negative outlook.
Respondents also provided insight into the approximate percentage their shop’s overhead costs represent compared to total annual expenses. When including all survey responses, this percentage equaled 32%.
Of the service charge rates studied, statistics provided included the average and median rates, as well as the mode, minimum and maximum rates charged for each service. To best illustrate this year’s data, it was presented in a “box-and-whisker” format, as well as via scatterplot graphs, to better demonstrate the frequency and distribution of charge rates for each service area.
Once again, respondents were able to add both attended and unattended rates for the following services: 5-axis machining, 3D printing steel core and cavities for conformal cooling, CNC milling, EDM drilling, gun drill operation, high-speed milling (30k plus RPM), sinker EDM, surface grinding and wire EDM.
Because this survey now is in its third year, this year’s report was better able to compare changing conditions across all services by tracking 2022 vs. 2023
data than in past reports.
The full 2023 report illustrates additional information on over 20 individual charge rates, as well as further charge rate breakdown by annual sales revenue and other features.
To protect the interests of its members and the competitive advantage of the US mold manufacturing industry, the final report is available at no cost only to AMBA members who participated in this survey process. AMBA members who did not participate are able to purchase the report for $399. This report will be unavailable to any non-member (regardless of participation). Eligible parties interested in purchasing the report can visit the AMBA publications page.
www.amba.org