

From a study conducted by MachineMetrics
With IoT coming to maturity and achieving market penetration, we have on our hands a whole new arsenal of data with which to drive decisions. In an increasingly complex manufacturing environment, manufacturers are looking for any edge they can get to remain competitive in a heavily globalized economy. Over the last three years, MachineMetrics has collected data directly from the controls and sensors of thousands of machine tools. These machines span across hundreds of companies in the US, representing all kinds of machine tools in all types of industries. These data have been collected in the “2019 State of the Industry.”
Two types of data were collected for the study.
Utilization data were pulled directly from the machines and are based on the percentage of time a machine is reporting an active state. An active state is sent by the control of the machine based on certain heuristics defined based on the domain of the machine. For example, on some machines, if a G-Code program is running, the machine is considered active. So, if a machine has 33% utilization in a day, it means that 8 out of 24 hours the machine was actively running a program. It does not mean that the spindle was active that whole time, but rather that it was reading and executing a series of commands from a G-Code program, which may include built-in pauses, set-up time, etc.
Downtime data were annotated by machine operators and are based on the percentage of time a machine is reporting an active state. An active state is sent by the control of the machine based on certain heuristics defined based on the domain of the machine. Machine operators are prompted to annotate downtime whenever a machine goes from Active to Inactive. Operators annotate based off pre-determined categories that executives in their company have determined. These annotations are then mapped to one of seven categories: Unplanned Mechanical, Planned Mechanical, Cleaning Machine, Operator Unavailable, Inspection, Lack Material/Jobs and Changeover.
Average machine utilization for Quarter 3, 2019, was 25.2%.
Downtime rates and reasons
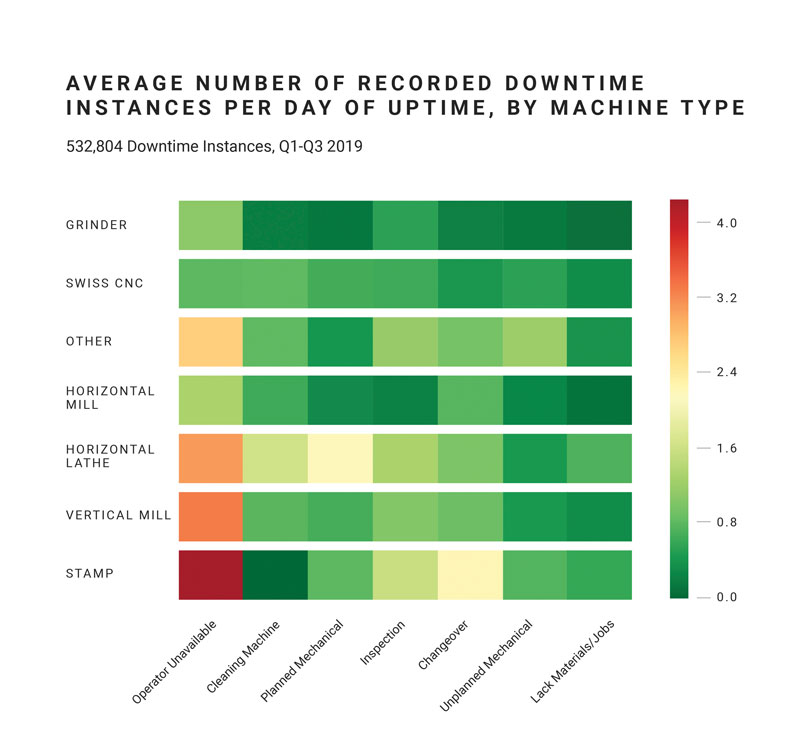
In addition to collecting raw utilization data, we also prompt operators to provide reasons for long periods of downtime. Looking at the rates at which various downtime reasons occur reveals a kind of “fingerprint” for each machine type in terms of its average operational and maintenance needs. Stamps stand out as particularly prone to losing productivity due to lack of an operator and also tend to be stopped more often for changeovers. This is consistent with their overall low utilization. Horizontal lathes exhibit relatively high rates of cleaning and planned mechanical service compared to other machine types. By contrast, grinders and Swiss CNCs encounter downtime more rarely and generally for broader sets of reasons. Shop owners could learn a lot about their own machines and operations by comparing against these patterns. (See Chart 1.)

According to our data, the most common reason for downtime is that there are not enough operators, confirming the belief that manufacturers can’t find enough skilled labor to run their shops. Downtime benchmarks can be used to inform your business planning practices. Perhaps if you have a disproportionate amount of downtime due to changeovers compared to the industry, you should consider analyzing ways in which this could be streamlined to better align with your peers. (See Chart 2.)
MachineMetrics is the machine data component of the Digital Factory; manufacturing’s first Industrial IoT platform designed for discrete manufacturing. For more information, call 413-341-5747, email info@machinemetrics.com or visit www.machinemetrics.com.