

by Rachael Pfenninger, director of strategic execution, AMBA
Earlier this year, the American Mold Builders Association (AMBA) surveyed US mold manufacturers on business conditions, key economic indicators, profit and other historic data. At that time, the 110 participating respondents identified three key growing challenges – foreign competition, cost pressure and profitability.
To help provide context to these key concerns and a better understanding of where US mold manufacturers have the opportunity to be most competitive and profitable, the AMBA gathered never-before-seen data: industry-wide shop rates in over 20 services in three service areas – engineering, moldmaking and specialty. The aggregate results have been published in its newest bi-annual benchmarking effort: the AMBA 2021 Shop Rate Report. To assemble the survey and the final report, the AMBA benchmarking team relied heavily on its 2021 Benchmarking Committee, which consists of executives from several US mold manufacturers within the AMBA community.
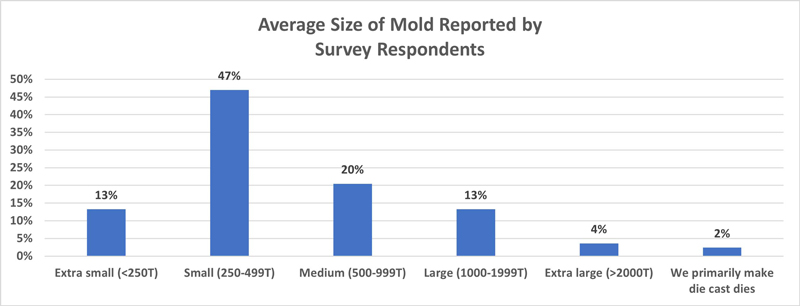
The final report includes survey responses from 83 US mold manufacturers from 21 states, primarily located in the Midwest region. 78% of respondents identified the automotive industry as a primary industry served, followed by the medical/optical/dental industry (58%) and the consumer products industry (49%). Three-quarters of this survey’s respondents report primarily building plastic injection molds, and just under half indicated that the average size of their molds is small (250-499 tons) (See chart 1).
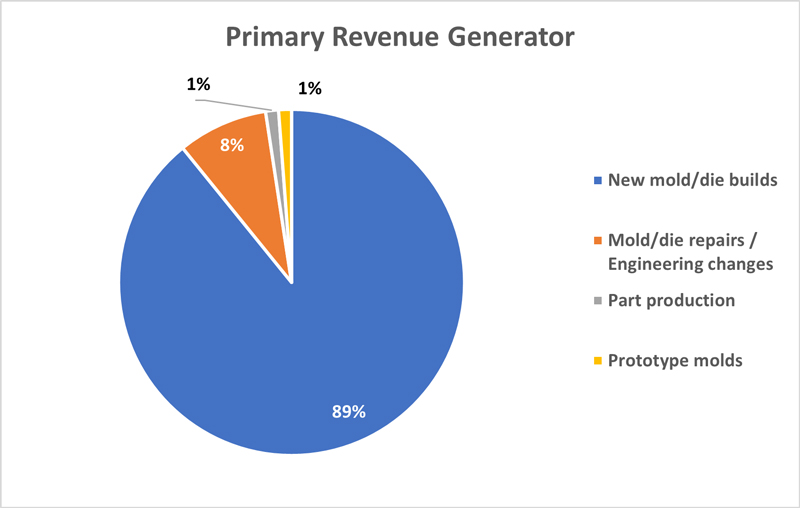
Overwhelmingly, respondents – 89% – identified new mold/die builds as their primary source of revenue (See chart 2).
A majority of respondents indicated that their average gross margin was relatively thin, while the remainder of respondents were split relatively evenly between the following upper ranges: 15-19%, 20-24% and 25% or more.
On average, mold manufacturers reported a current utilization of 74%, with companies in the $5M-$9.9M range reporting the most positive outlook. Anticipated capacity is expected to rise an average of 5% through the end of the year to 81%, while companies in the $1M-$2.49M anticipated remaining at a capacity utilization of 69%. Respondents also provided insight into whether or not they offered commission on mold sales to their sales staff. Interestingly, although a majority of mold manufacturers (74%) reported that they did not offer commission on mold sales to their sales staff, it is worth noting that the 21% of respondents who do distribute commissions reported a higher-than-average capacity utilization of 81%.
Of the service charge rates studied, no service had only one mode (a single rate that was cited most frequently). For this reason, notable modes – or “peaks” – were identified for every charge rate. On average, the service that drew the highest charge rate was mold flow simulation, followed by mold sampling. Polishing, on the other hand, averaged the lowest rate, followed closely by surface grinding.
In addition to gathered charge rates, the final report includes information on mold build details, average gross margins, current and anticipated capacities, commission structure and a breakdown of popular charge rates by annual sales revenue and specialty service charge rates by industry.
The full 2021 report provides additional information on over 20 individual charge rates, as well as further charge rate breakdown by annual sales revenue and/or by the top three primary industries served in the final portion of this report.
To protect the interests of its members and the competitive advantage of the US mold manufacturing industry, the final report is available only to AMBA members for $149 or to non-members that participated in the survey process for $349 (an access code will be required). Eligible parties interested in purchasing the report can visit the AMBA publications page at www.AMBA.org.