
by Perc Pineda, PhD, chief economist, Plastics Industry Association
“Time flies when you’re having fun.” And this year went fast. But I’m not sure if it was all fun for the US plastics industry in 2021. After all, the plastics industry continues to face challenges from the pandemic. As the year closes in a few days, the U.S. plastics industry performance in 2021 can be summarized in seven charts. As in last year’s synopsis of 2020, the charts presented below are not all-inclusive considering that November and December data is still forthcoming. These charts are based on PLASTICS’ projections.
-
Industrial Production of Plastics Products Manufacturing
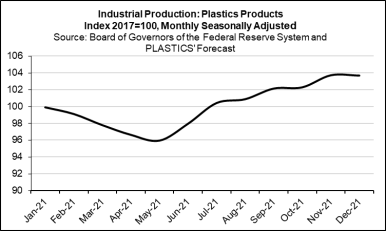
Low plastics material and resins supply caused the plastics product manufacturing to slow earlier this year but turned around after May. Although resin production has increased, the plastics industry continues to face labor shortages. However, it appears that plastics production has been running on high gear to meet higher demand for plastics and plastic products. In November, plastics production was up 7.1% from a year earlier. Compared to the end of the COVID-19 recession in April 2020, plastics products manufacturing rose 23.0%. With 2021 expected to end on a high note, a 4.5% increase in plastics production can be expected in December year-on-year.
-
Plastics and Rubber Shipments
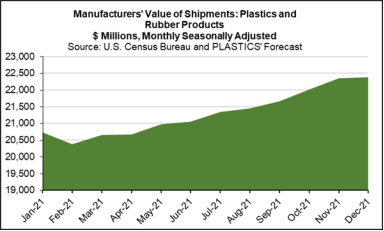
Plastics and rubber shipments have been increasing since February this year. It increased 7.5% in October from a year earlier to $22,019 million, according to the latest estimates of the U.S. Census Bureau. Business conditions remained favorable in November and assuming that’s unchanged in December, this year could close with shipments 9.5% higher than December last year.
-
Plastics Manufacturing Employment
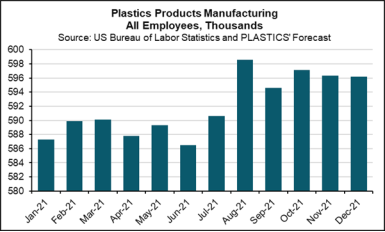
The US plastics industry continued to experience low labor supply in 2021 – reflecting the economy’s labor participation rate that appears to be stuck around 61.0% since June last year. Plastics products manufacturing saw an increase in employees in August reaching 598.6 thousand. The US Bureau of Labor Statistics estimates plastics manufacturing employees at 597.7 thousand in October. Considering the low supply for workers, it is unlikely that hiring increased dramatically in November, albeit in November plastics and rubber unemployment was estimated by BLS at 1.5%. This means that November and December plastics manufacturing employment could be at 596.3 and 596.2 thousand, respectively.
-
Molds for Plastics Trade
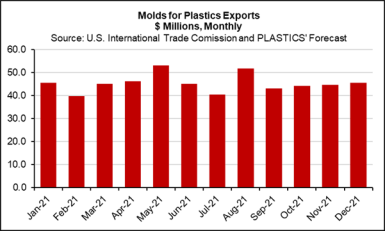
This year saw stable plastics molds exports. Except in February, where exports were $39.9 million, plastics molds exports stayed above $40.0 million through October. May and August exports at $53.1 million and $57.3 million, respectively. It is projected that the two remaining months of 2021 will continue to see exports above $40.0 million. Molds exports in 2021 are less volatile than in 2020. However, the uneven pace of emergence between countries from the pandemic could cause only moderate increases in molds exports in 2022.
-
Producer Prices in Plastics Material and Resins Manufacturing
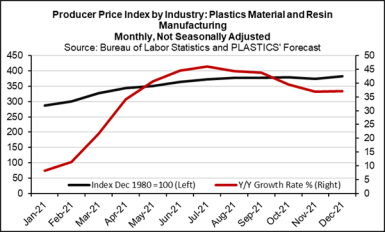
After many years of stable resin prices, 2021 saw prices climbed into double-digits due to ongoing interruption of the pandemic and adverse weather conditions that caused resin shortages. While the causes of resin shortages have been analyzed by many industry observers, strong demand for plastics and plastics products sustained elevated prices throughout 2021. However, data suggest that resin prices peaked in the summer months – price increases moderated thereafter, which is expected through December. It remains to be seen when prices will return to their pre-pandemic levels. Given that supply chain issues could remain unresolved—at least in H1-2022—resin prices could remain elevated, but the rates of increase will continue to moderate as resin supply catches up with resin demand.
-
Capacity Utilization in Plastics Material and Resins Manufacturing
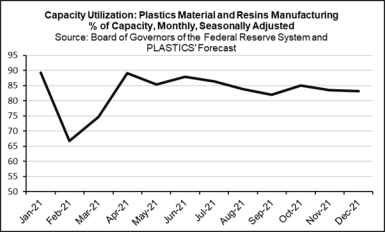
The plastics material and resins manufacturing capacity utilization rates averaged 88.0% in 2019 and 2020. This year could see that rate to average lower, at 83.1%, as supply continues to adjust. While the pandemic affected capacity utilization, adverse weather had a larger negative impact on capacity utilization than the pandemic per se. There is ample room for plastics material and resin manufacturing utilization rate to expand, which could be expected in 2022.
-
Plastics Machinery Imports
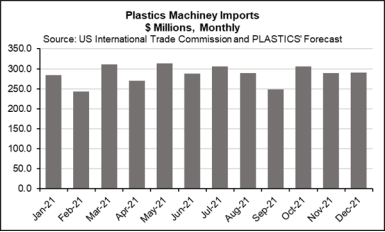
Although the US manufacturing sector continues to grapple with supply chain issues, 2021 is looking to be a banner year for US plastics machinery. Demand has been running hot—in primary machinery types and auxiliaries—as converters deal with higher demand. Helped by low-interest rates to finance equipment investment, low labor supply caused processors to enhance productivity through plastics equipment and auxiliaries. Data shows that plastics machinery imports have stayed stable in 2021 as equipment suppliers continue to service robust demand. In October, plastics machinery imports totaled $305.5 million—a 15.0% increase from a year earlier. While imports could slow in November and December, the likely scenario is from plastics machinery imports to increase 13.2% from 2020.
The Plastics Industry Association (PLASTICS) is the only organization that supports the entire plastics supply chain, representing nearly one million workers in the $395 billion U.S. industry. Since 1937, PLASTICS has been working to make its members and the industry more globally competitive while advancing recycling and sustainability. To learn more about PLASTICS’ education initiatives, industry-leading insights and events, networking opportunities and policy advocacy and the largest plastics trade show in the Americas, NPE: The Plastics Show, visit www.plasticsindustry.org.
